Most fleet managers know that fuel cards help them save on gas. But what about the information they make? That’s where the real value is.
There is a record of when, where, how much, what kind of fuel, and which vehicle your drivers buy every time they do so. That information, over time, gives you a clear picture of how your fleet really works. When you know how to read it correctly, fleet performance metrics with fuel cards can help you save money and get more done.
This is how to get the most out of the information that your fuel cards are already collecting.
Table of Contents
What Fleet Performance Metrics With Fuel Cards Actually Measure
You should know what fuel card data can tell you before you look at specific metrics.
Advanced reporting tools show you more than just basic transaction lists and fleet performance. Analytics show the cost of each driver, vehicle, or route, as well as trends in fuel efficiency and spending.
You’re not just keeping track of how much money you spend; you’re also keeping track of how you spend it. Which drivers always fill up their tanks too much? What cars use more gas than they need to for their routes? Fleet performance metrics with fuel cards answer all of these questions without adding any work to your team’s day.
Fleet Performance Metrics From Fuel Card Reports
Fuel Consumption Per Vehicle
This is the most important number for any fleet to track. How much fuel does each vehicle use compared to what it should based on its route and load?
By combining fuel card data, fleets can learn key insights into their performance, such as how long their vehicles will last, how to optimize routes, and how fuel-efficient they are. This helps fleets use data to make choices that will save them money and help the environment over time.
It’s easy to tell when something is wrong if you keep an eye on how much fuel you use. If a truck uses 15% more fuel than other trucks on the same routes, it means the driver, the truck’s maintenance, or the routing is wrong. Without the data, you won’t be able to catch it.
Cost Per Mile
Cost per mile directly links fuel costs to the amount of work done, making it easy to compare vehicles, drivers, and routes. You can keep an eye on it as one of the best fleet efficiency metrics.
If the cost per mile goes up for a vehicle that doesn’t change its route, it means something is wrong that needs to be looked into, like wear and tear, bad driving, or a worsening maintenance problem. It’s always less expensive to catch it early than late.
Fuel Usage Trends Over Time
You can see what happened with just one transaction. Fuel usage trends show you what’s changing, and that’s where you make smart decisions.
Trend analyses reveal long-term patterns that support planning, and exception reports highlight anomalies that require investigation.
By looking at trends once a month, you can catch small spending increases before they turn into big problems with your budget. It also tells you if changes to how things work, like new routes, driver training, and upgrades to maintenance, are really making a difference.
Driver Performance Analysis Through Fuel Data
You can use fuel cards to measure both people and vehicles, just like you can use fleet performance metrics. Because each transaction is linked to a specific driver, you can compare driver performance analysis across your whole team.
Transaction data shows how much gas each driver uses, helping managers identify both the best drivers and those who need more training. When drivers know their fuel use is being monitored and compared to standards, they usually drive more responsibly.
You don’t have to guess which drivers have bad habits because you have the numbers. The data clearly shows a driver who regularly buys more gas than others on similar routes or makes purchases outside of approved hours and locations.
Research shows that driver fuel management programs reduce fuel use by holding people accountable and providing specific feedback. People have good reasons to drive in ways that save money when they are rewarded for it based on fuel-efficiency metrics.
The data from your fuel card doesn’t just show you what’s wrong; it also gives you the tools to make a coaching and rewards program that will really help.
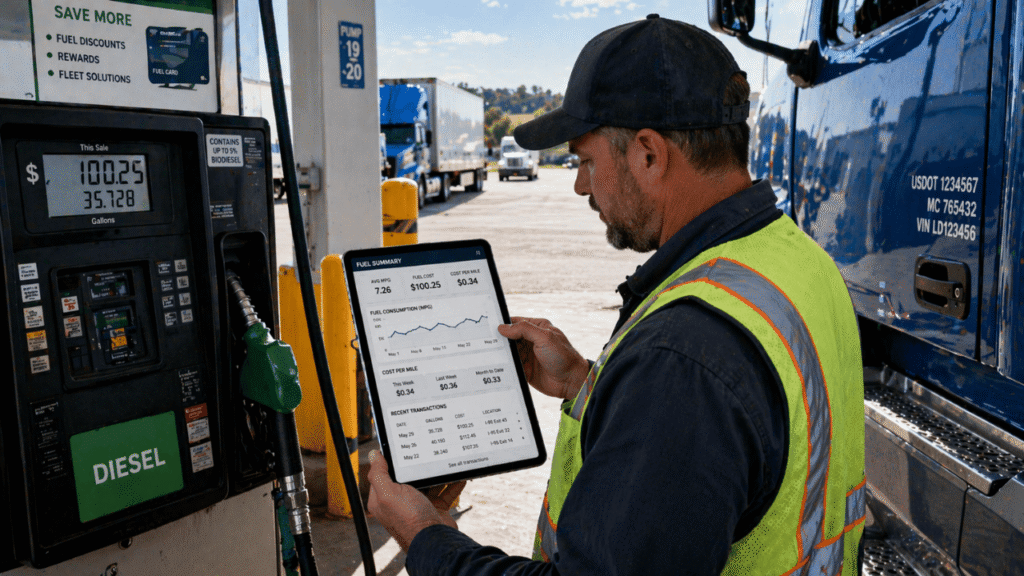
Using Data Reporting Dashboards Effectively
You can only use the data fuel cards if you can read them quickly and act on them. That’s what data reporting dashboards are for.
Customizable dashboards display key performance indicators in easy-to-understand ways that help you make decisions quickly. On the other hand, automated exception reports highlight unusual situations that require investigation.
Every morning, you can quickly check your operational KPIs, such as total spending, flagged transactions, vehicles over their consumption benchmarks, and drivers who triggered alerts. You don’t have to look through spreadsheets to see what needs to be done right away.
Your dashboard should only show the most important metrics for your business. For a trucking operations team that wants to keep costs down, that could mean looking at cost per mile, total fuel cost per vehicle, and driver rankings based on fuel use. It might show purchase location flags and time-of-day controls for fleets that care about following the rules.
Performance Benchmarking: Know Your Baseline
You can’t fix things if you don’t know how bad they are. Performance benchmarking is the process of using historical data to set future goals.
First, figure out the average MPG for each type of vehicle, the cost per mile for each type of route, and the average fuel cost per driver per week. These are your most important metrics. After that, you’ll know if you’re getting better, staying the same, or going in the wrong direction every time you report.
Detailed analytics track spending patterns and fuel efficiency metrics that can vary by driver or vehicle. This gives managers the information they need to set realistic goals and make sure teams are doing their jobs.
You can get much more useful information by combining telematics data with fuel card fleet analytics. You can get a full fleet productivity analysis by combining GPS location, idle time, and speed data with fuel transaction records. No single tool can give you this information on its own.
Make Your Fuel Cards Work Harder
Fleet performance metrics on fuel cards aren’t just nice-to-haves; they’re a way to get ahead of the competition. The fleets that are always more cost-effective and efficient don’t always have newer equipment or pay less for fuel. They’re managing better because they’re measuring better.
Set up your dashboards, review trends monthly, use the data to coach drivers, and always compare yourself to others. Fuel cards give you all the information you need to run a smarter, leaner, and more responsible business. You can start with the data you’re already collecting.
Want to make the most of your fleet data?
Visit getfuelcard.com, call +1 (905) 901-1601, or email hello@getfuelcard.com to help you find tools for trucking and fleet management that can keep track of, improve, and grow your business.